Finding correlation between tweets and future stock prices using ML/NLP approaches
[this is a graduation project of the course "Natural Language Processing course, stream 3, autumn 2022"]
nlpfinancemlai
Stocks Tweets Project
This project is devoted to the study of the relationship between publications in social networks and the corresponding stock prices.
At the first stage of the project, the original dataset from the article [Jaggi M. at al., 2021] was taken for work. It contains 6.4 million tweets for 25 stocks.
After examining the dataset a number of issues had been found and fixed:
added stop words preprocessing (initially stop words were just removed)
corrected filling missing data algorithm to more stable one
data labels were recalculated in a different way (with isolation in time of the message release date and the price change date)
Experiment setup
After loading the dataset, it is divided into train and test sets in a ratio of 0.85 to 0.15. To check the stability and variability of each model, the split is carried out several times with a different seed value. Each partition is tested independently of the others.
Of all the dataset fields, only one is used - the preprocessed message text, the rest of the features (date, time, author, etc.) are intentionally not used in the pipeline of this work to avoid distortion in the search for the correlation of the entities under study.
To estimate model quality, we used the Accuracy metric. As the dataset is perfectly balanced, this metric is very intuitive, as the value 0.5 corresponds to random noise.
After training and saving all the models, an ensemble of models is created to evaluate the cross-correlation of the models and obtain the final maximum achievable accuracy value.
Results
Below is a final table and graph with results of individual models and their ensembles.
Model Type
Accuracy
Model
File Size
Comments
Baseline
(Random Guess)
0.500 +- 0.003
-
It’s not an actual model (DummyClassifier with strategy="uniform")
Transformer (Roberta)
0.545 +- 0.002
350 MB
Roberta and DistilRoberta had the same accuracy in our experiments
GBDT (Catboost)
0.560 +- 0.003
5 MB
Model details: CatBoostClassifier
n_estimators=300, max_depth = 8
Naive Bayes
0.568 +- 0.002
58 MB + 49 MB
Model details: MultinomialNB on TF-IDF features for word n-grams with length from 1 to 3, alpha = 0.1
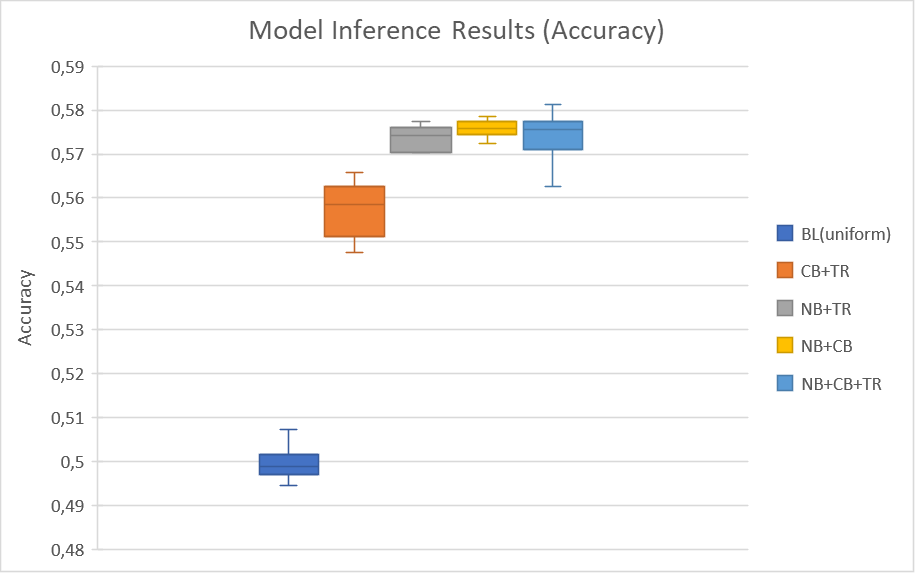
Boxplot graphs for pairwise and triple ensembles. (BL - baseline model (random uniform), CB - CatBoost model NB - Naive Bayes model, TR - Transformer model)
Conclusion and future work
The results turned out to be promising - despite the complexity of the subject area (predicting future price behavior), we managed to get statistically significant accuracy values (0.582) with a random baseline of 0.500 + -0.003. A separate interesting conclusion was that the size and algorithmic complexity of machine learning models do not always determine the result of their application in each specific case, requiring researchers to conduct more versatile experiments at the modeling stage.
Possible next steps:
Calculate business-oriented metrics (closer to the real potential usage of the idea)
Labels: Take not just the next calendar day, but the next N days (up to a week). Also it's possible to experiment with the 0.5% threshold that is used for class label calculation.
Models: Complete results with RNN approaches (LSTM / GRU) - the main runs have already been carried out, they need to be added to the final ensemble.
References
Yilmaz, E. S., Ozpolat, A., & Destek, M. A. (2022). Do Twitter sentiments really effective on energy stocks? Evidence from the intercompany dependency. Environmental Science and Pollution Research, 29(52), 78757-78767. https://www.academia.edu/download/89681397/s11356-022-21269-9.pdf
Jaggi, M., Mandal, P., Narang, S., Naseem, U., & Khushi, M. (2021). Text Mining of Stocktwits Data for Predicting Stock Prices. arXiv preprint arXiv:2103.16388. https://arxiv.org/abs/2103.16388
Our website uses cookies, including web analytics services. By using the website, you consent to the processing of personal data using cookies. You can find out more about the processing of personal data in the Privacy policy