We well know GANs for success in the realistic image generation. Howev
Tabular GAN for uneven data
Research project
We well know GANs for success in realistic image generation. However, they can be applied in tabular data generation. We will review and examine some recent papers about tabular GANs in action.
We will show that GAN might be an option for highly skewed data between train and test by applying it with adversarial training.
Making train dataset more similar to test dataset in case of highly skewed data
Making new anonymous train dataset for development or for selling such data
Contribute
At the moment, the project has only one main developer (@insaf in ODS slack or via email iashrapov@gmail.com), you are free to contact and ask any questions. We may discuss further development.
Run all experiments python run_experiment.py. Run all experiments python run_experiment.py. You may add more datasets, adjust validation types, and categorical encoders.
Observe metrics across all experiment in console or in ./results/fit_predict_scores.txt
Task formalization
Let say we have T_train and T_test (train and test set respectively). We need to train the model on T_train and make predictions on T_test. However, we will increase the train by generating new data by GAN [1][2][3], somehow similar to T_test, without using ground truth labels.
Experiment design
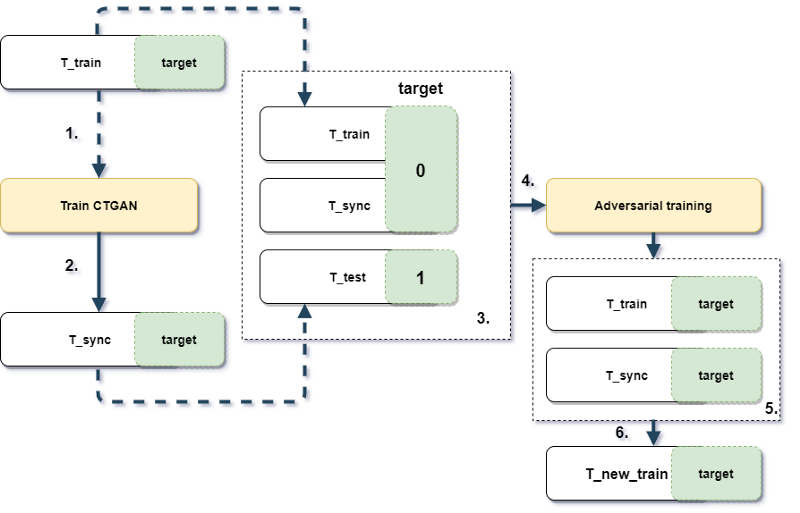
Let say we have T_train and T_test (train and test set respectively). The size of T_train is smaller and might have different data distribution. First of all, we train CTGAN on T_train with ground truth labels (step 1), then generate additional data T_synth (step 2). Secondly, we train boosting in an adversarial way on concatenated T_train and T_synth (target set to 0) with T_test (target set to 1) (steps 3 & 4). The goal is to apply newly trained adversarial boosting to obtain rows more like T_test. Note - initial ground truth labels aren't used for adversarial training. As a result, we take top rows from T_train and T_synth sorted by correspondence to T_test (steps 5 & 6), and train new boosting on them and check results on T_test.
Of course for the benchmark purposes we will test ordinal training without these tricks and another original pipeline but without CTGAN (in step 3 we won't use T_sync).
Datasets
All datasets came from different domains. They have a different number of observations, number of categorical and numerical features. The task is a binary classification. Preprocessing of datasets was simple: removed all time-based columns from datasets. The remaining columns were either categorical or numerical.
Results
To determine the best sampling strategy, ROC AUC scores of each dataset were scaled (min-max scale) and then averaged among the dataset.
We can see that GAN outperformed other sampling types in 2 datasets. Whereas sampling from the original outperformed other methods in 3 of 7 datasets. Of course, there isn’t much difference. but these types of sampling might be an option. Of course, there isn’t much difference. but these types of sampling might be an option.
dataset_name
None
gan
sample_original
credit
0.997
0.998
0.997
employee
0.986
0.966
0.972
mortgages
0.984
0.964
0.988
poverty_A
0.937
0.950
0.933
taxi
0.966
0.938
0.987
adult
0.995
0.967
0.998
telecom
0.995
0.868
0.992
Table 1.1 Different sampling results across the dataset, higher is better (100% - maximum per dataset ROC AUC)
sample_type
mean
std
None
0.980
0.036
gan
0.969
0.06
sample_original
0.981
0.032
Table 1.2 Different sampling results, higher is better for a mean (ROC AUC), lower is better for std (100% - maximum per dataset ROC AUC)
Let’s define same_target_prop as equal 1 then the target rate for train and test is different no more than 5%. So then we have almost the same target rate in train and test None and sample_original better. However, gan is starting to perform noticeably better than target distribution changes.
sample_type
same_target_prop
prop_test_score
None
0
0.964
None
1
0.985
gan
0
0.966
gan
1
0.945
sample_original
0
0.973
sample_original
1
0.984
Table 1.3 same_target_prop is equal 1 then the target rate for train and test are different no more than 5%. Higher is better.
Acknowledgments
The author would like to thank Open Data Science community [5] for many valuable discussions and educational help in the growing field of machine and deep learning. Also, special big thanks to Sber [6] for allowing solving such tasks and providing computational resources.
References
[1] Ian J. Goodfellow, Jean Pouget-Abadie, Mehdi Mirza, Bing Xu, David Warde-Farley, Sherjil Ozair, Aaron Courville, Yoshua Bengio. Generative Adversarial Networks (2014). arXiv:1406.2661
[2] Lei Xu LIDS, Kalyan Veeramachaneni. Synthesizing Tabular Data using Generative Adversarial Networks (2018). arXiv:1811.11264v1 [cs.LG]
[3] Lei Xu, Maria Skoularidou, Alfredo Cuesta-Infante, Kalyan Veeramachaneni. Modeling Tabular Data using Conditional GAN (2019). arXiv:1907.00503v2 [cs.LG]
[4] Denis Vorotyntsev. Benchmarking Categorical Encoders (2019). Medium post
[5] Tero Karras, Samuli Laine, Miika Aittala, Janne Hellsten, Jaakko Lehtinen, Timo Aila. Analyzing and Improving the Image Quality of StyleGAN (2019) arXiv:1912.04958v2 [cs.CV]
[6] ODS.ai: Open data science (2020), https://ods.ai/
[7] Sber (2020), https://www.sberbank.ru/
Our website uses cookies, including web analytics services. By using the website, you consent to the processing of personal data using cookies. You can find out more about the processing of personal data in the Privacy policy